Social Service
Part of Creator content in social shopping
Measuring product interest separately from creator reach
Keep creator reach, product actions, site behaviour and orders in separate measures so each stage answers a clear question.
Creator reach shows how widely content was seen. Product interest asks whether people took a shopping action for the item shown. Report the two separately, then follow the path towards purchase. A post can travel widely without prompting product investigation, while a smaller audience can produce useful product questions and visits.
Define the stages before comparing creators
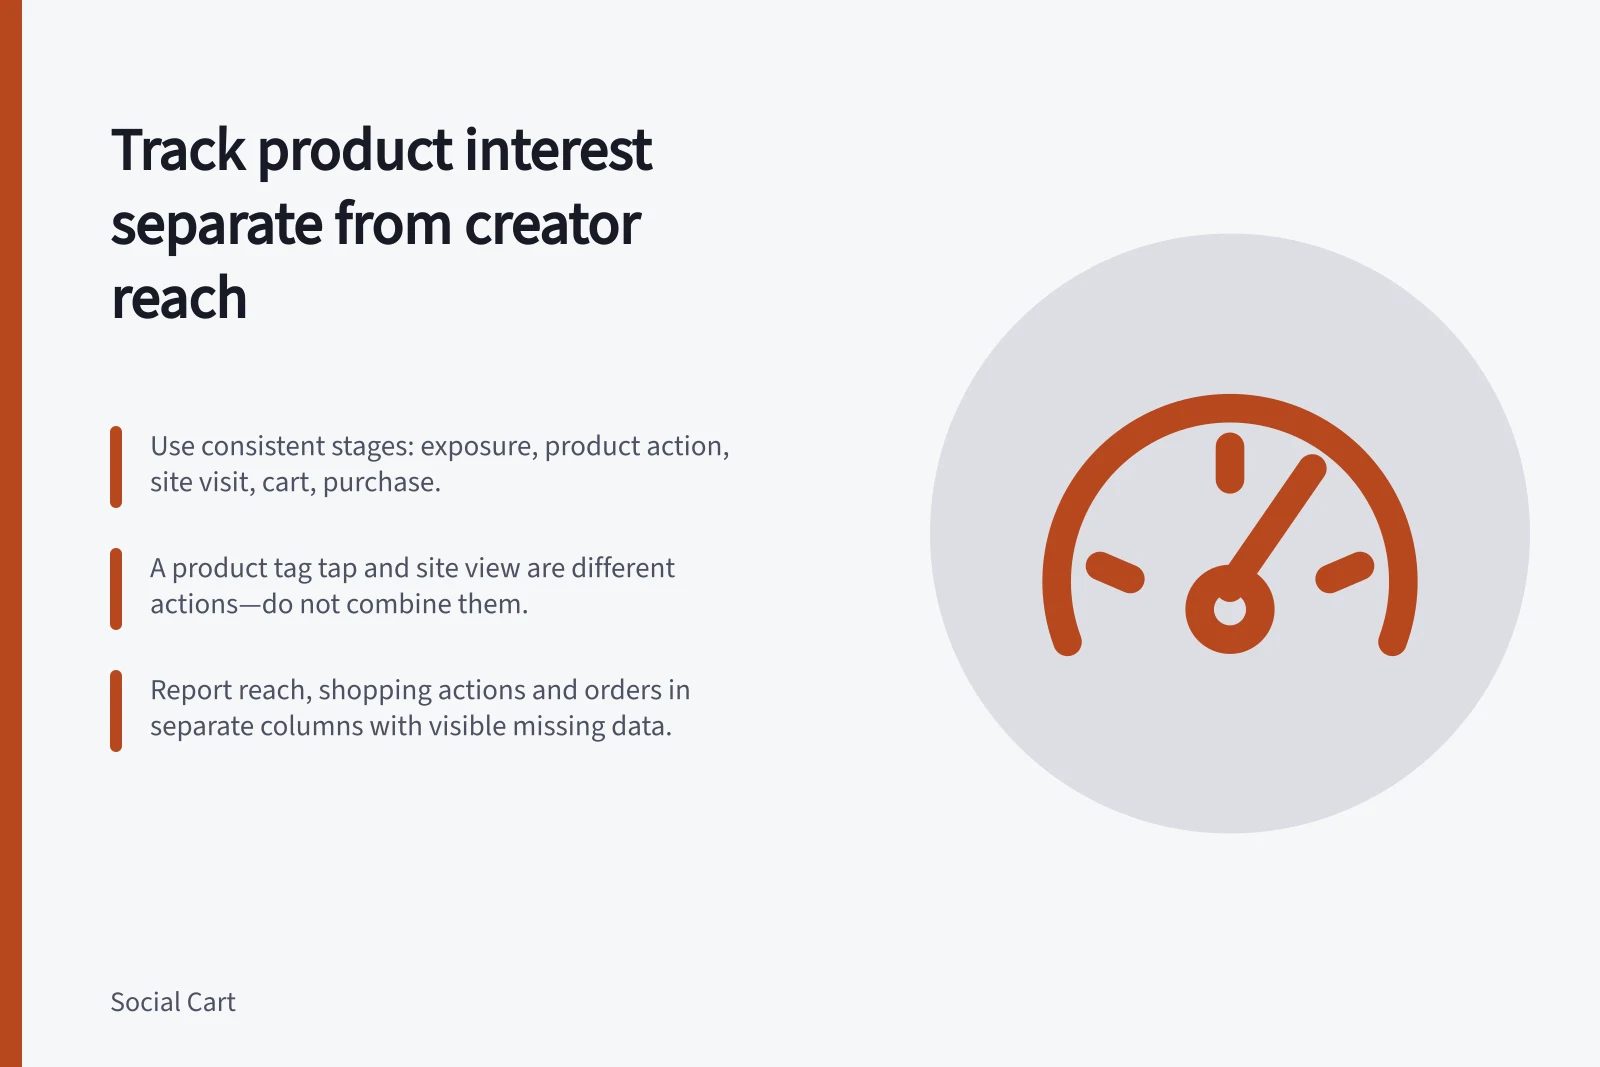
Use a small, consistent sequence for every asset: content exposure, product interaction, product-page visit, cart action and completed purchase. Add creator, asset, product and reporting period to each row. Record exactly what each platform metric means; a video view, a reached account and an impression are not interchangeable.
A tap on a product tag may sit inside a social app, while a product-page view belongs to the retailer's site. Do not combine them into one click total.
| Stage | Question it can answer |
|---|---|
| Reach or views | How much exposure did the asset receive under that platform's definition? |
| Product actions | Did viewers seek details about the shown item? |
| Site item views and carts | Did visitors inspect or start to buy the product on the site? |
| Orders and refunds | What recorded purchase activity remained after later changes? |
The table is a reporting framework, not a claim that every platform supplies every stage. If a stage is unavailable, mark it unavailable rather than estimating it from another metric.
Stages to Track for Accurate Product Interest Measurement
- Reach or viewsHow much exposure did the asset receive under that platform's definition?
- Product actionsDid viewers seek details about the shown item?
- Site item views and cartsDid visitors inspect or start to buy the product on the site?
- Orders and refundsWhat recorded purchase activity remained after later changes?
Connect site visits carefully
For links to a retailer's website, use a consistent campaign naming scheme to distinguish creator assets where the platform permits it. Google Analytics documents URL builders for collecting campaign data with custom URLs.
Test whether those parameters survive the route to the landing page. A platform's native product tag may report differently from a website link; check the actual setup before promising asset-level attribution.
On the website, Google Analytics documents recommended events. Google Analytics also provides guidance on ecommerce metrics, so choose one definition per report.
An item view is evidence of inspection, not proof of purchase intent or a sale. An order is a stronger outcome, but attribution can still be incomplete when customers return later or use another device.
Key Metrics to Monitor Across the Customer Journey
- Platform Reach (views)
- Measures content exposure per platform definition
- Product Tag Taps
- Indicates interest in a product within social app
- Site Item Views
- Evidence of inspection on retailer’s website
- Completed Orders
- Final purchase outcome after refunds and adjustments
Use gaps to decide what to inspect
If exposure is high but product actions are low, review whether the item and shopping cue are clear. If product actions are high but site views are low, inspect the tag, redirect and loading path. If site views are high but carts are low, compare the demonstrated variant with the page, price and delivery information.
These are diagnostic hypotheses; test the route and customer feedback before changing the creative.
Compare creators on the same product, time window and metric definitions where possible. Note paid amplification, stockouts and promotions alongside the figures. Present reach, shopping actions and orders as separate columns, with missing data visible. This gives the team a clearer decision than naming the creator with the largest view count the best seller.
Creator Performance: Reach vs. Product Actions vs. Orders
- Creator A
- High reach, low product actions
- Creator B
- High product actions, low site views
- Creator C
- High site views, low cart additions